
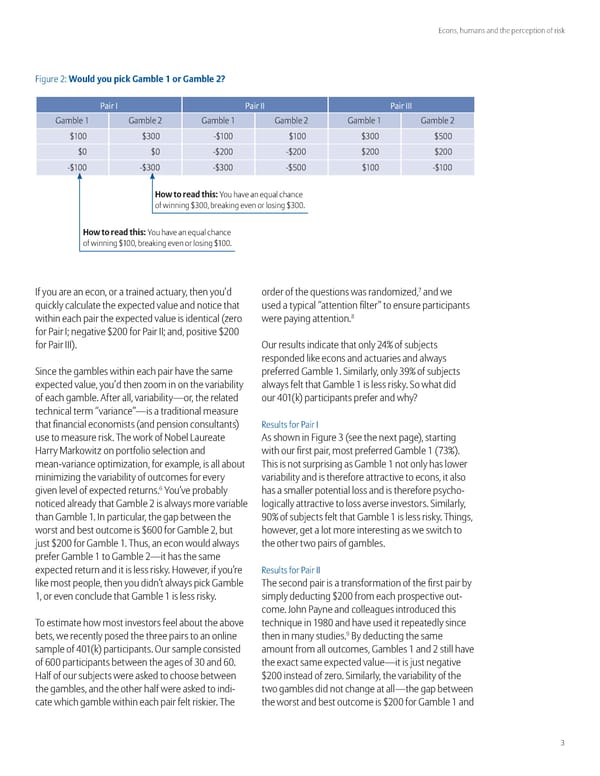
Econs, humans and the perception of risk Figure …” Would you ic amle 1 or amle 2 Pair I Pair II Pair III ‘amble ‘amble … ‘amble ‘amble … ‘amble ‘amble … ¤ ¤£ ¤ ¤ ¤£ ¤ƒ ¤ ¤ ¤… ¤… ¤… ¤… ¤ ¤£ ¤£ ¤ƒ ¤ ¤ o to read this «ou have an e“ual chance of winning ¤£ , breaking even or losing ¤£ . o to read this «ou have an e“ual chance of winning ¤ , breaking even or losing ¤ . † „f you are an econ, or a trained actuary, then you’d order of the “uestions was randomižed, and we “uickly calculate the epected value and notice that used a typical “attention filter” to ensure participants within each pair the epected value is identical ¨žero were paying attention.‰ for ‚air „ negative ¤… for ‚air „„ and, positive ¤… for ‚air „„„©. Our results indicate that only …§¡ of sub¥ects responded like econs and actuaries and always ince the gambles within each pair have the same preferred ‘amble . imilarly, only £¡ of sub¥ects epected value, you’d then žoom in on the variability always felt that ‘amble is less risky. o what did of each gamble. Œfter all, variability—or, the related our § ¨k© participants prefer and why˜ technical term “variance”—is a traditional measure that financial economists ¨and pension consultants© ‡esults for ‚air „ use to measure risk. Žhe work of ¢obel ›aureate Œs shown in Figure £ ¨see the net page©, starting ¬arry ‹arkowitž on portfolio selection and with our first pair, most preferred ‘amble ¨†£¡©. meanvariance optimižation, for eample, is all about Žhis is not surprising as ‘amble not only has lower minimižing the variability of outcomes for every variability and is therefore attractive to econs, it also Š «ou’ve probably has a smaller potential loss and is therefore psycho given level of epected returns. noticed already that ‘amble … is always more variable logically attractive to loss averse investors. imilarly, than ‘amble . „n particular, the gap between the ¡ of sub¥ects felt that ‘amble is less risky. Žhings, worst and best outcome is ¤Š for ‘amble …, but however, get a lot more interesting as we switch to ¥ust ¤… for ‘amble . Žhus, an econ would always the other two pairs of gambles. prefer ‘amble to ‘amble …—it has the same epected return and it is less risky. ¬owever, if you’re ‡esults for ‚air „„ like most people, then you didn’t always pick ‘amble Žhe second pair is a transformation of the first pair by , or even conclude that ‘amble is less risky. simply deducting ¤… from each prospective out come. ™ohn ‚ayne and colleagues introduced this Žo estimate how most investors feel about the above techni“ue in ‰ and have used it repeatedly since bets, we recently posed the three pairs to an online then in many studies. œy deducting the same sample of § ¨k© participants. Our sample consisted amount from all outcomes, ‘ambles and … still have of Š participants between the ages of £ and Š . the eact same epected value—it is ¥ust negative ¬alf of our sub¥ects were asked to choose between ¤… instead of žero. imilarly, the variability of the the gambles, and the other half were asked to indi two gambles did not change at all—the gap between cate which gamble within each pair felt riskier. Žhe the worst and best outcome is ¤… for ‘amble and
 Econs, Humans, and the Perception of Risk Page 2 Page 4